Overview
This guide will show you how to use the TensorFlow Profiler with TensorBoard to gain insight into and get the maximum performance out of your GPUs, and debug when one or more of your GPUs are underutilized.
If you are new to the Profiler:
- Get started with the TensorFlow Profiler: Profile model performance notebook with a Keras example and TensorBoard.
- Learn about various profiling tools and methods available for optimizing TensorFlow performance on the host (CPU) with the Optimize TensorFlow performance using the Profiler guide.
Keep in mind that offloading computations to GPU may not always be beneficial, particularly for small models. There can be overhead due to:
- Data transfer between the host (CPU) and the device (GPU); and
- Due to the latency involved when the host launches GPU kernels.
Performance optimization workflow
This guide outlines how to debug performance issues starting with a single GPU, then moving to a single host with multiple GPUs.
It is recommended to debug performance issues in the following order:
- Optimize and debug the performance on one GPU:
- Check if the input pipeline is a bottleneck.
- Debug the performance of one GPU.
- Enable mixed precision (with
fp16(float16)) and optionally enable XLA.
- Optimize and debug the performance on the multi-GPU single host.
For example, if you are using a TensorFlow distribution strategy to train a model on a single host with multiple GPUs and notice suboptimal GPU utilization, you should first optimize and debug the performance for one GPU before debugging the multi-GPU system.
As a baseline for getting performant code on GPUs, this guide assumes you are
already using tf.function. The Keras Model.compile and Model.fit APIs will
utilize tf.function automatically under the hood. When writing a custom
training loop with tf.GradientTape, refer to the
Better performance with tf.function
on how to enable tf.functions.
The next sections discuss suggested approaches for each of the scenarios above to help identify and fix performance bottlenecks.
1. Optimize the performance on one GPU
In an ideal case, your program should have high GPU utilization, minimal CPU (the host) to GPU (the device) communication, and no overhead from the input pipeline.
The first step in analyzing the performance is to get a profile for a model running with one GPU.
TensorBoard's Profiler overview page—which shows a top level view of how your model performed during a profile run—can provide an idea of how far away your program is from the ideal scenario.
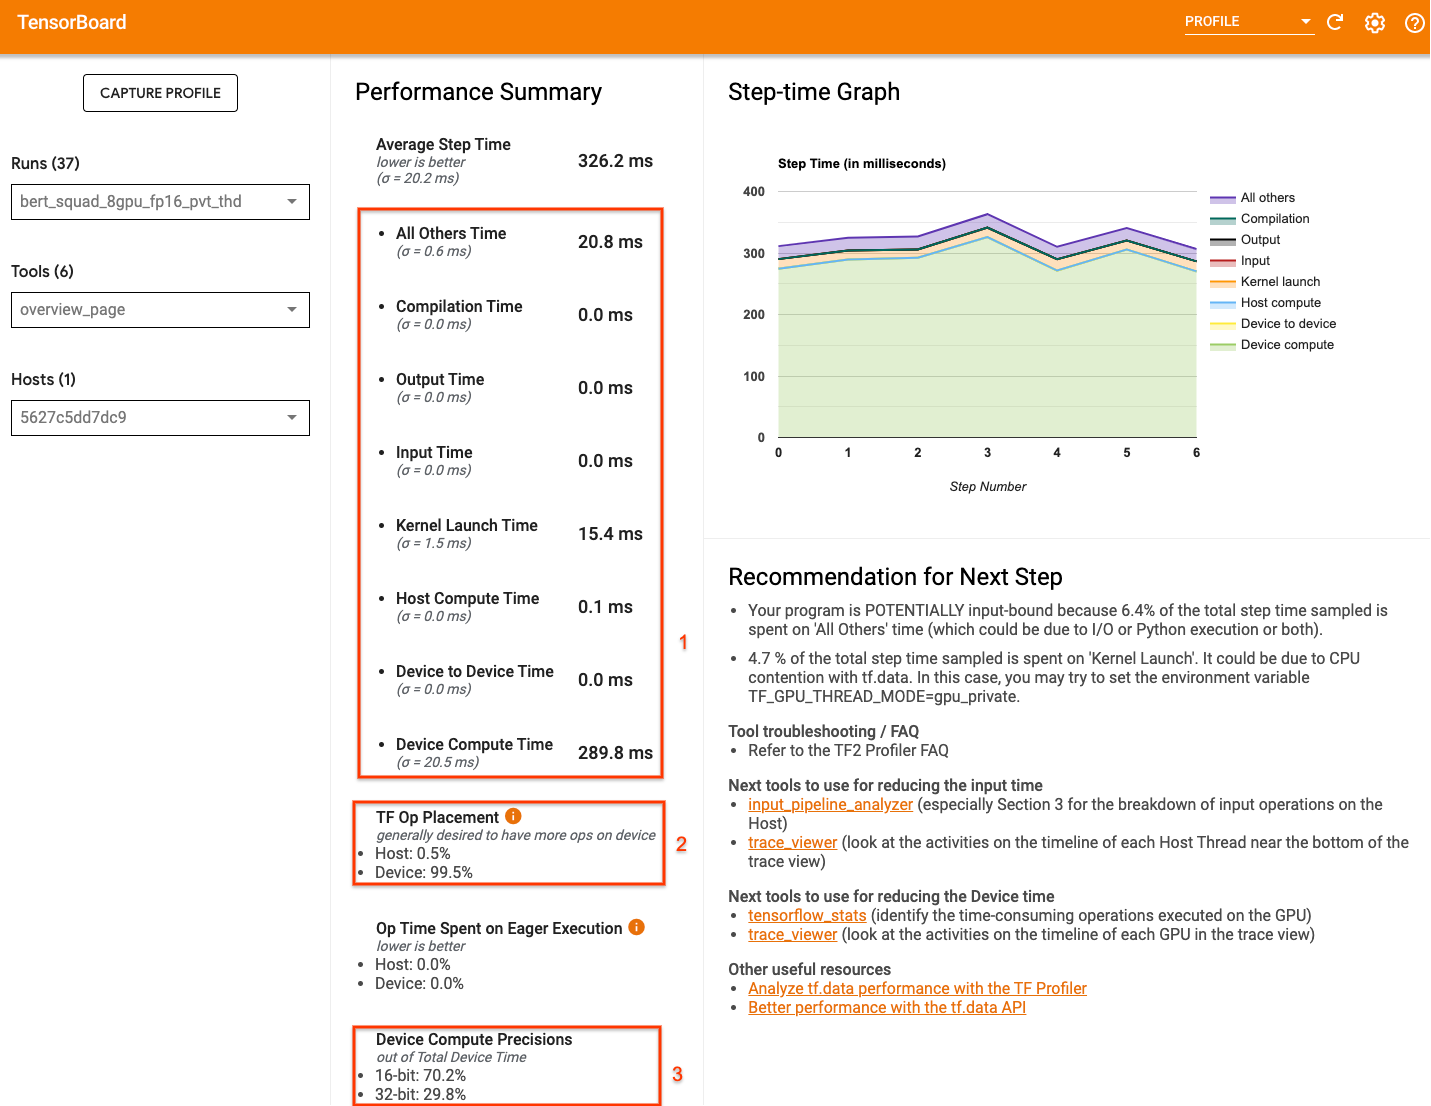
The key numbers to pay attention to the overview page are:
- How much of the step time is from actual device execution
- The percentage of ops placed on device vs host
- How many kernels use
fp16
Achieving optimal performance means maximizing these numbers in all three cases. To get an in-depth understanding of your program, you will need to be familiar with TensorBoard's Profiler trace viewer. The sections below show some common trace viewer patterns that you should look for when diagnosing performance bottlenecks.
Below is an image of a model trace view running on one GPU. From the TensorFlow Name Scope and TensorFlow Ops sections, you can identify different parts of the model, like the forward pass, the loss function, backward pass/gradient calculation, and the optimizer weight update. You can also have the ops running on the GPU next to each Stream, which refer to CUDA streams. Each stream is used for specific tasks. In this trace, Stream#118 is used to launch compute kernels and device-to-device copies. Stream#119 is used for host-to-device copy and Stream#120 for device to host copy.
The trace below shows common characteristics of a performant model.

For example, the GPU compute timeline (Stream#118) looks "busy" with very few gaps. There are minimal copies from host to device (Stream #119) and from device to host (Stream #120), as well as minimal gaps between steps. When you run the Profiler for your program, you may not be able to identify these ideal characteristics in your trace view. The rest of this guide covers common scenarios and how to fix them.
1. Debug the input pipeline
The first step in GPU performance debugging is to determine if your program is input-bound. The easiest way to figure this out is to use the Profiler’s Input-pipeline analyzer, on TensorBoard, which provides an overview of time spent in the input pipeline.
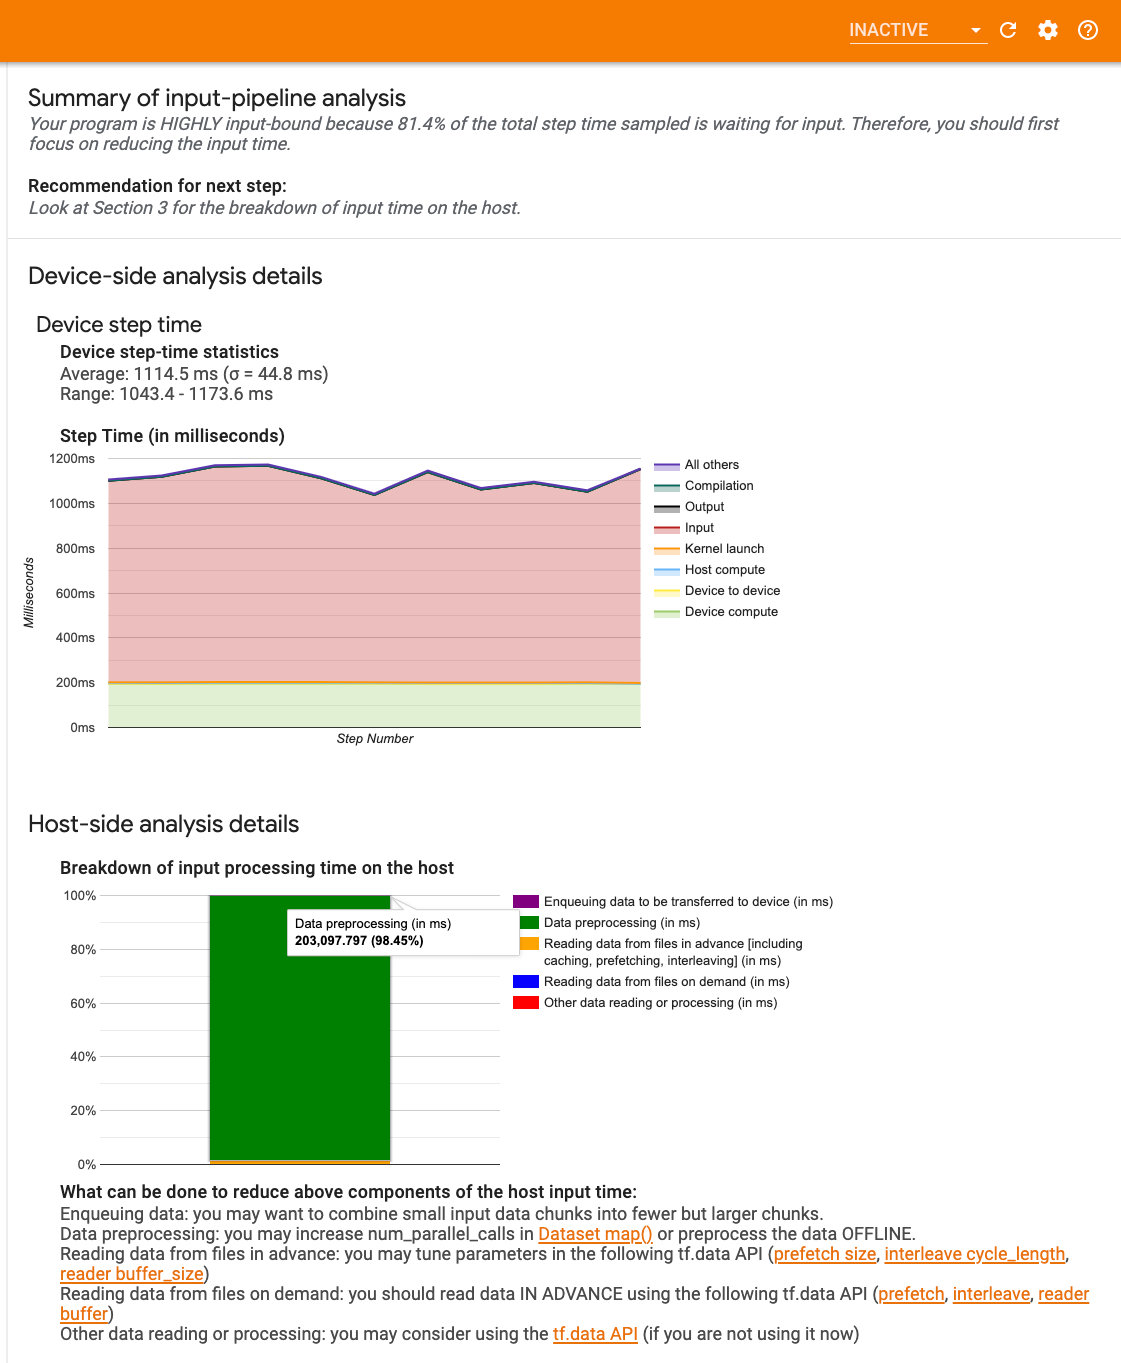
You can take the following potential actions if your input-pipeline contributes significantly to step time:
- You can use the
tf.data-specific guide to learn how to debug your input pipeline. - Another quick way to check if the input pipeline is the bottleneck is to use randomly generated input data that does not need any pre-processing. Here is an example of using this technique for a ResNet model. If the input pipeline is optimal, you should experience similar performance with real data and with generated random/synthetic data. The only overhead in the synthetic data case will be due to input data copy which again can be prefetched and optimized.
In addition, refer to the best practices for optimizing the input data pipeline.
2. Debug the performance of one GPU
There are several factors that can contribute to low GPU utilization. Below are some scenarios commonly observed when looking at the trace viewer and potential solutions.
1. Analyze gaps between steps
A common observation when your program is not running optimally is gaps between training steps. In the image of the trace view below, there is a large gap between steps 8 and 9, meaning that the GPU is idle during that time.

If your trace viewer shows large gaps between steps, this could be an indication that your program is input bound. In that case you should refer to the previous section on debugging your input pipeline if you have not already done so.
However, even with an optimized input pipeline, you can still have gaps between
the end of one step and the start of another due to CPU thread contention.
tf.data makes use of background threads to parallelize pipeline processing.
These threads may interfere with GPU host-side activity that happens at the
beginning of each step, such as copying data or scheduling GPU operations.
If you notice large gaps on the host side, which schedules these ops on the GPU,
you can set the environment variable TF_GPU_THREAD_MODE=gpu_private. This
ensures that GPU kernels are launched from their own dedicated threads, and
don't get queued behind tf.data work.
Gaps between steps can also be caused by metric calculations, Keras callbacks,
or ops outside of tf.function that run on the host. These ops don’t have as
good performance as the ops inside a TensorFlow graph. Additionally, some of
these ops run on the CPU and copy tensors back and forth from the GPU.
If after optimizing your input pipeline you still notice gaps between steps in
the trace viewer, you should look at the model code between steps and check if
disabling callbacks/metrics improves performance. Some details of these ops are
also on the trace viewer (both device and host side).The recommendation in this
scenario is to amortize the overhead of these ops by executing them after a
fixed number of steps instead of every step. When using the Model.compile method in
the tf.keras API, setting the steps_per_execution flag does
this automatically. For custom training loops, use tf.while_loop.
2. Achieve higher device utilization
1. Small GPU kernels and host kernel launch delays
The host enqueues kernels to be run on the GPU, but there is a latency (around 20-40 μs) involved before kernels are actually executed on the GPU. In an ideal case, the host enqueues enough kernels on the GPU such that the GPU spends most of its time executing, rather than waiting on the host to enqueue more kernels.
The Profiler's overview page on TensorBoard shows how much time the GPU was idle due to waiting on the host to launch kernels. In the image below, the GPU is idle for about 10% of the step time waiting on kernels to be launched.
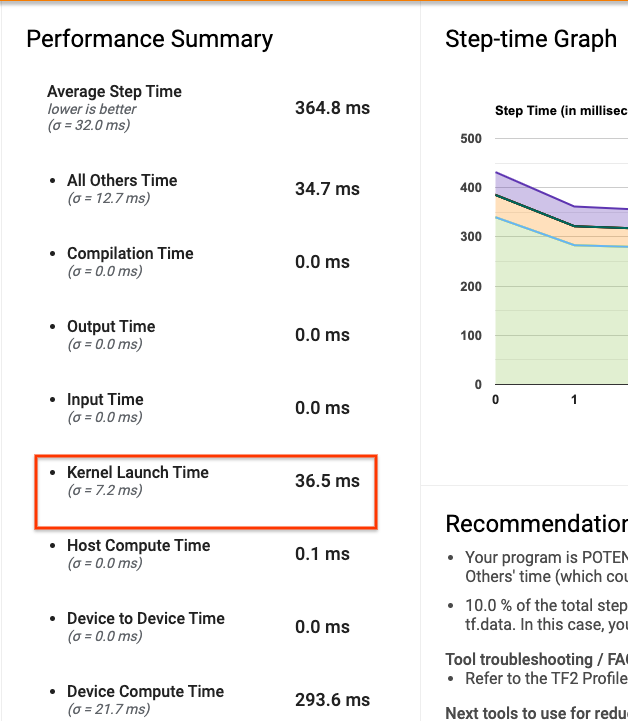
The trace viewer for this same program shows small gaps between kernels where the host is busy launching kernels on the GPU.

By launching a lot of small ops on the GPU (like a scalar add, for example), the host might not keep up with the GPU. The TensorFlow Stats tool in TensorBoard for the same Profile shows 126,224 Mul operations taking 2.77 seconds. Thus, each kernel is about 21.9 μs, which is very small (around the same time as launch latency) and can potentially result in host kernel launch delays.

If your trace viewer shows many small gaps between ops on the GPU like in the image above, you can:
- Concatenate small tensors and use vectorized ops or use a larger batch size to make each launched kernel do more work, which will keep the GPU busy for longer.
- Make sure you are using
tf.functionto create TensorFlow graphs, so that you are not running ops in a pure eager mode. If you are usingModel.fit(as oppose to a custom training loop withtf.GradientTape), thentf.keras.Model.compilewill automatically do this for you. - Fuse kernels using XLA with
tf.function(jit_compile=True)or auto-clustering. For more details, go to the Enable mixed precision and XLA section below to learn how to enable XLA to get higher performance. This feature can lead to high device utilization.
2. TensorFlow op placement
The Profiler overview page shows you the percentage of ops placed on the host vs. the device (you can also verify the placement of specific ops by looking at the trace viewer. Like in the image below, you want the percentage of ops on the host to be very small compared to the device.

Ideally, most of the compute intensive ops should be placed on the GPU.
To find out which devices the operations and tensors in your model are assigned
to, set tf.debugging.set_log_device_placement(True) as the first statement of
your program.
Note that in some cases, even if you specify an op to be placed on a particular
device, its implementation might override this condition (example:tf.unique).
Even for single GPU training, specifying a distribution strategy, such as
tf.distribute.OneDeviceStrategy, can result in more deterministic placement of
ops on your device.
One reason for having the majority of ops placed on the GPU is to prevent excessive memory copies between the host and the device (memory copies for model input/output data between host and device are expected). An example of excessive copying is demonstrated in the trace view below on GPU streams #167, #168, and #169.
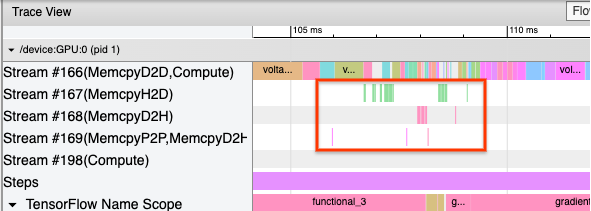
These copies can sometimes hurt the performance if they block GPU kernels from executing. Memory copy operations in the trace viewer have more information about the ops that are the source of these copied tensors, but it might not always be easy to associate a memCopy with an op. In these cases, it is helpful to look at the ops nearby to check if the memory copy happens at the same location in every step.
3. More efficient kernels on GPUs
Once your program's GPU utilization is acceptable, the next step is to look into increasing the efficiency of the GPU kernels by utilizing Tensor Cores or fusing ops.
1. Utilize Tensor Cores
Modern NVIDIA® GPUs have specialized Tensor Cores that can significantly improve the performance of eligible kernels.
You can use TensorBoard's
GPU kernel stats
to visualize which GPU kernels are Tensor Core-eligible, and which kernels are
using Tensor Cores. Enabling fp16 (see Enabling Mixed Precision section below)
is one way to make your program’s General Matrix Multiply (GEMM) kernels (matmul
ops) utilize the Tensor Core. GPU kernels use the Tensor Cores efficiently when
the precision is fp16 and input/output tensor dimensions are divisible by 8 or
16 (for int8).
For other detailed recommendations on how to make kernels efficient for GPUs, refer to the NVIDIA® deep learning performance guide.
2. Fuse ops
Use tf.function(jit_compile=True) to fuse smaller ops to form bigger kernels
leading to significant performance gains. To learn more, refer to the
XLA guide.
3. Enable mixed precision and XLA
After following the above steps, enabling mixed precision and XLA are two optional steps you can take to improve performance further. The suggested approach is to enable them one by one and verify that the performance benefits are as expected.
1. Enable mixed precision
The TensorFlow
Mixed precision guide
shows how to enable fp16 precision on GPUs. Enable
AMP on NVIDIA® GPUs to
use Tensor Cores and realize up to 3x overall speedups when compared to using
just fp32 (float32) precision on Volta and newer GPU architectures.
Make sure that matrix/tensor dimensions satisfy requirements for calling kernels that use Tensor Cores. GPU kernels use the Tensor Cores efficiently when the precision is fp16 and input/output dimensions are divisible by 8 or 16 (for int8).
Note that with cuDNN v7.6.3 and later, convolution dimensions will automatically be padded where necessary to leverage Tensor Cores.
Follow the best practices below to maximize the performance benefits of fp16
precision.
1. Use optimal fp16 kernels
With fp16 enabled, your program’s matrix multiplications (GEMM) kernels,
should use the corresponding fp16 version that utilizes the Tensor Cores.
However, in some cases, this does not happen and you do not experience the
expected speedup from enabling fp16, as your program falls back to the
inefficient implementation instead.
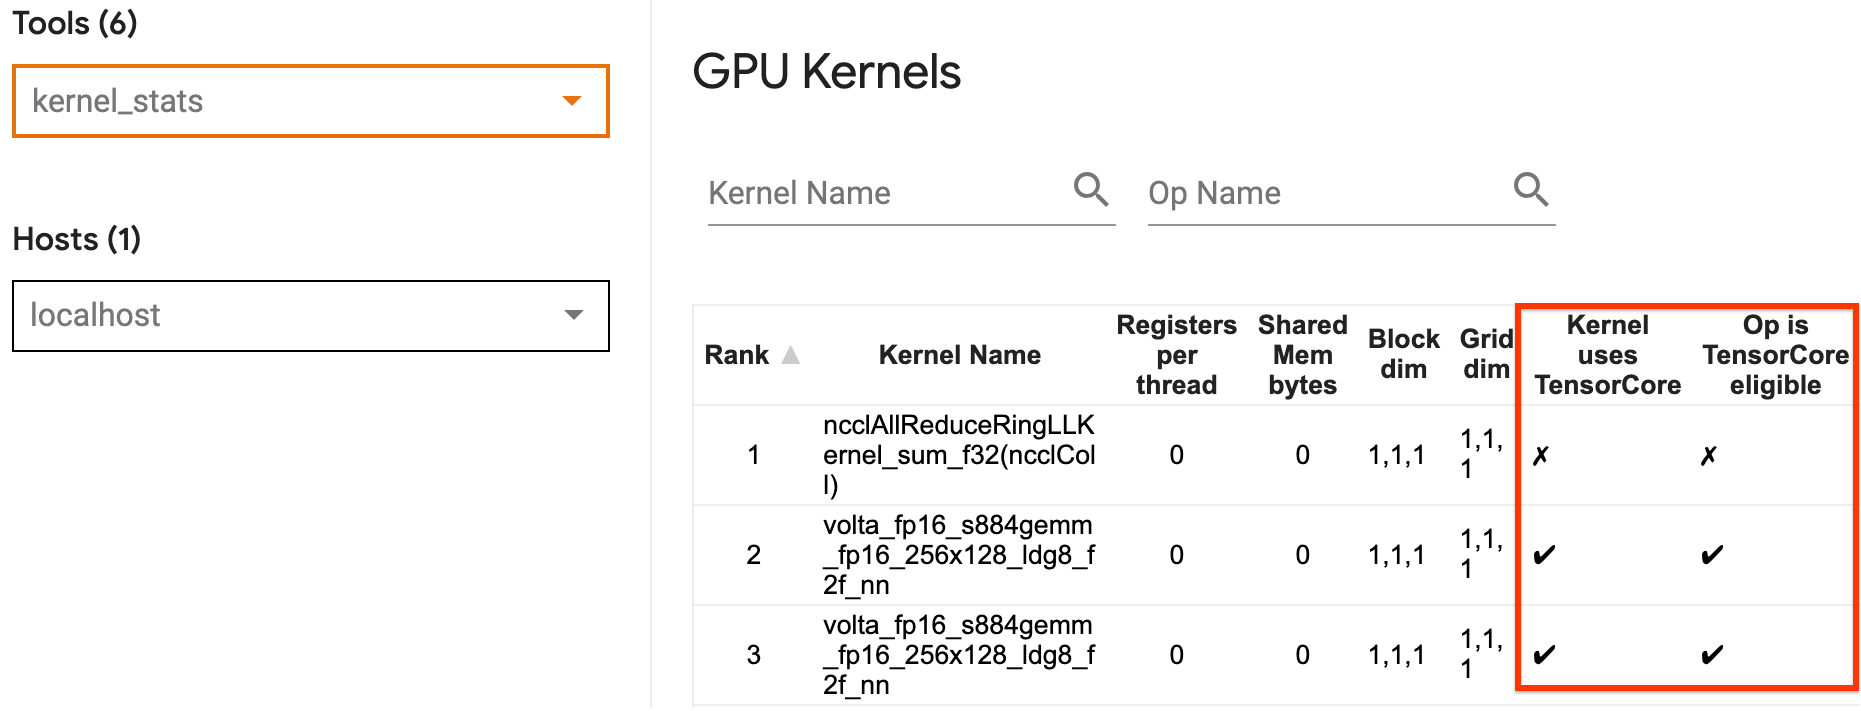
The GPU kernel
stats page shows which ops are Tensor Core eligible and which kernels are
actually using the efficient Tensor Core. The
NVIDIA® guide on deep learning performance
contains additional suggestions on how to leverage Tensor Cores. Additionally,
the benefits of using fp16 will also show in kernels that were previously
memory bound, as now the ops will take half the time.
2. Dynamic vs. static loss scaling
Loss scaling is necessary when using fp16 to prevent underflow due to low
precision. There are two types of loss scaling, dynamic and static, both of
which are explained in greater detail in the
Mixed Precision guide.
You can use the mixed_float16 policy to automatically enable loss scaling
within the Keras optimizer.
When trying to optimize performance, it is important to remember that dynamic loss scaling can introduce additional conditional ops that run on the host, and lead to gaps that will be visible between steps in the trace viewer. On the other hand, static loss scaling does not have such overheads and can be a better option in terms of performance with the catch that you need to specify the correct static-loss scale value.
2. Enable XLA with tf.function(jit_compile=True) or auto-clustering
As a final step in getting the best performance with a single GPU, you can
experiment with enabling XLA, which will fuse ops and lead to better device
utilization and a lower memory footprint. For details on how to enable XLA in
your program with tf.function(jit_compile=True) or auto-clustering, refer to
the XLA guide.
You can set the global JIT level to -1 (off), 1, or 2. A higher level is
more aggressive and may reduce parallelism and use more memory. Set the value to
1 if you have memory restrictions. Note that XLA does not perform well for
models with variable input tensor shapes as the XLA compiler would have to keep
compiling kernels whenever it encounters new shapes.
2. Optimize the performance on the multi-GPU single host
The tf.distribute.MirroredStrategy API can be used to scale model training
from one GPU to multiple GPUs on a single host. (To learn more about how to do
distributed training with TensorFlow, refer to the
Distributed training with TensorFlow,
Use a GPU, and
Use TPUs guides and the
Distributed training with Keras
tutorial.)
Although the transition from one GPU to multiple GPUs should ideally be scalable out of the box, you can sometimes encounter performance issues.
When going from training with a single GPU to multiple GPUs on the same host, ideally you should experience the performance scaling with only the additional overhead of gradient communication and increased host thread utilization. Because of this overhead, you will not have an exact 2x speedup if you move from 1 to 2 GPUs, for example.
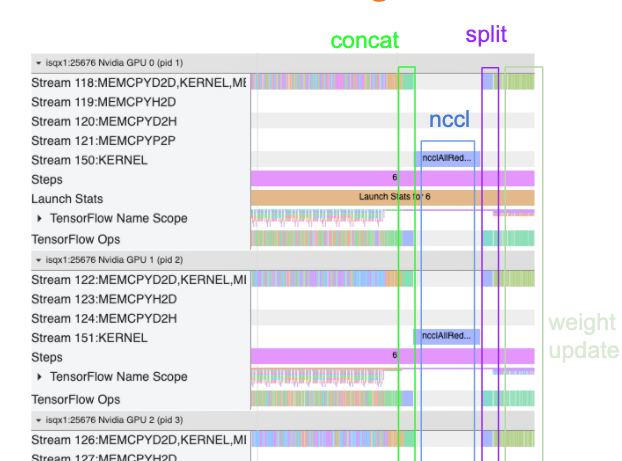
The trace view below shows an example of the extra communication overhead when training on multiple GPUs. There is some overhead to concatenate the gradients, communicate them across replicas, and split them before doing the weight update.
The following checklist will help you achieve better performance when optimizing the performance in the multi-GPU scenario:
- Try to maximize the batch size, which will lead to higher device utilization and amortize the costs of communication across multiple GPUs. Using the memory profiler helps get a sense of how close your program is to peak memory utilization. Note that while a higher batch size can affect convergence, this is usually outweighed by the performance benefits.
- When moving from a single GPU to multiple GPUs, the same host now has to process much more input data. So, after (1), it is recommended to re-check the input pipeline performance and make sure it is not a bottleneck.
- Check the GPU timeline in your program's trace view for any unnecessary AllReduce calls, as this results in a synchronization across all devices. In the trace view shown above, the AllReduce is done via the NCCL kernel, and there is only one NCCL call on each GPU for the gradients on each step.
- Check for unnecessary D2H, H2D and D2D copy operations that can be minimized.
- Check the step time to make sure each replica is doing the same work. For
example, it can happen that one GPU (typically,
GPU0) is oversubscribed because the host mistakenly ends up putting more work on it. - Lastly, check the training step across all GPUs in your trace view for any ops that are executing sequentially. This usually happens when your program includes control dependencies from one GPU to another. In the past, debugging the performance in this situation has been solved on a case-by-case basis. If you observe this behavior in your program, file a GitHub issue with images of your trace view.
1. Optimize gradient AllReduce
When training with a synchronous strategy, each device receives a portion of the input data.
After computing the forward and backwards passes through the model, the gradients calculated on each device need to be aggregated and reduced. This gradient AllReduce happens after the gradient calculation on each device, and before the optimizer updates the model weights.
Each GPU first concatenates the gradients across the model layers, communicates
them across GPUs using tf.distribute.CrossDeviceOps
(tf.distribute.NcclAllReduce is the default), and then returns the gradients
after reduction per layer.
The optimizer will use these reduced gradients to update the weights of your model. Ideally, this process should happen at the same time on all GPUs to prevent any overheads.
The time to AllReduce should be approximately the same as:
(number of parameters * 4bytes)/ (communication bandwidth)
This calculation is useful as a quick check to understand whether the
performance you have when running a distributed training job is as expected, or
if you need to do further performance debugging. You can get the number of
parameters in your model from Model.summary.
Note that each model parameter is 4 bytes in size since TensorFlow uses fp32
(float32) to communicate gradients. Even when you have fp16 enabled, NCCL
AllReduce utilizes fp32 parameters.
To get the benefits of scaling, the step-time needs to be much higher compared to these overheads. One way to achieve this is to use a higher batch size as batch size affects step time, but does not impact the communication overhead.
2. GPU host thread contention
When running multiple GPUs, the CPU’s job is to keep all of the devices busy by efficiently launching GPU kernels across the devices.
However, when there are a lot of independent operations that the CPU can schedule on one GPU, the CPU can decide to use a lot of its host threads to keep one GPU busy, and then launch kernels on another GPU in a non-deterministic order. This can cause a skew or negative scaling, which can negatively affect the performance.
The trace viewer below
shows the overhead when the CPU staggers GPU kernel launches inefficiently, as
GPU1 is idle and then starts running ops after GPU2 has started.

The trace view for the host shows that the host is launching kernels on GPU2
before launching them on GPU1 (note that the below tf_Compute* ops are not
indicative of CPU threads).

If you experience this kind of staggering of GPU kernels in your program’s trace view, the recommended action is to:
- Set the TensorFlow environment variable
TF_GPU_THREAD_MODEtogpu_private. This environment variable will tell the host to keep threads for a GPU private. - By default,
TF_GPU_THREAD_MODE=gpu_privatesets the number of threads to 2, which is sufficient in most cases. However, that number can be changed by setting the TensorFlow environment variableTF_GPU_THREAD_COUNTto the desired number of threads.
